Ever heard the saying “Data is the new oil”?
In today’s world, data has indeed become a new kind of currency, driving everything from business decisions to medical research. But how do we make sense of this deluge of data?
Welcome to the realm of data analysis, a field that extracts meaning from raw data to support decision-making. This crucial skill has become the beating heart of successful businesses worldwide, an art form that turns mountains of numbers into coherent and actionable insights.
Yet, you don’t need to break the bank to master this valuable discipline! In this Best Courses Guide (BCG), I’ve compiled a list of the best data analysis courses around the web, ranging from courses by independent instructors, to universities and learning institutions, and even big-name companies. Some of the courses here are free or free to audit, some are paid, and a small minority even come with free certification.
Click on the shortcuts for more details:
Here are our top picks
Click to skip to the course details:
What is Data Analysis?
Data analysis, put simply, is the practice of extracting useful actionable insights from raw complex data.
For example, a data analyst working in a retail company could analyze sales data to identify which products are selling best, which are underperforming, and why. They might look at data from different regions or stores to see if there are variations in performance. These insights could help the company decide what products to stock more of and which ones to discontinue.
Or in an e-commerce company, they might examine customer behavior data to understand shopping patterns, which can then guide the businesses’ marketing strategies, website design, and product offerings.

This might sound simple, but reality is often disappointing. Most data that arrives at the data analyst’s doorstep is dirty. Thus, data analysts have to clean and organize the data into an analyzable state. And that’s if the data isn’t flawed or biased!
Thus, data analysts use a variety of tools for their workflow, not only to help them clean and analyze data but to also present it to other less data-inclined fellows. Some of the most commonly used ones are:
- Spreadsheets: Applications like Microsoft Excel are commonly used for basic data analysis tasks.
- SQL: Many data analysts use SQL to retrieve, manipulate, and analyze data stored in relational databases.
- Statistical Software: Tools such as R and SAS offer advanced statistical analysis capabilities.
- Data Visualization Software: Tableau, and PowerBI make it easy for analysts to create visually appealing and interactive dashboards.
- A programming language like Python, R, or Julia: Sometimes, data analysts need more flexibility and power than what traditional tools can offer. That’s where programming languages come in. You can handle large datasets, perform complex statistical analyses, develop machine learning models, automate repetitive tasks, create custom data visualizations, and more.
By the way, the links above lead to their respective BCG subjects. So if you want to learn each topic in more detail, check them out.
What’s the difference between Data Analysis and Data Science?
Data analysis and data science are two terms often used interchangeably. However, they represent different, albeit interrelated, fields.
Data analysis is a component of data science. It is more descriptive than prescriptive, as it focuses on interpreting the results and uncovering patterns to aid decision-making.
On the other hand, data science is more broad and prescriptive. Data scientists might do the same work as data analysts, but often use machine learning algorithms to predict future trends based on current data. If you want to know more about data science, check out my data science BCG.
Why become a data analyst?
Data analysts are in high demand in more places than you think! They are needed in a diverse range of fields, including healthcare, finance, marketing, technology. That’s the reason why the U.S. Bureau of Labor Statistics projects that the demand for data science and analytical skills will grow by 28% by 2026.
And with high demand comes attractive salaries! According to Glassdoor, as of 2024, the average total pay for data analysts in the United States is approximately $84,000 per year.
Why You Should Trust Us
Class Central, a Tripadvisor for online education, has helped 60 million learners find their next course. We’ve been combing through online education for more than a decade to aggregate a catalog of 200,000 online courses and 200,000 reviews written by our users. And we’re online learners ourselves: combined, the Class Central team has completed over 400 online courses, including online degrees.
Courses Overview
- Eight of the courses in this ranking are free or free-to-audit while the other two are paid
- Only one course in this ranking isn’t suitable for beginners, the rest are beginner-friendly.

Another banger course from the University of Helsinki, this Data Analysis with Python course is the best undergraduate-level course for new-to-Python programmers looking to dive head-first into the world of data.
Why? Because this text-based course not only covers essential concepts like data cleaning, data wrangling, data visualization, and even a dash of machine learning, but it also comes with tons of machine-graded hands-on coding exercises to solidify your NumPy, pandas, and matplotlib coding skills. And to top it all off, you’ll complete one of three peer-reviewed capstone projects where you’ll analyze a dataset, explain the data you have, and make predictions of new data. This is a great opportunity for putting into practice all that you’ve learned so far.
No knowledge of Python is needed to take this course, though you are expected to have programmed before. Additionally, you’ll need to put in a lot of work; the course is 7 weeks long and each week has about 5 to 20 hours of lessons and exercises to complete.
Unfortunately, unlike Helsinki’s other courses, it isn’t easy to get a certificate. You’d need to register your credits in their study register and then request an official transcript of records. However, the course does have an official Discord server run by instructors and volunteers for learners to ask questions.
| Institution | University of Helsinki |
| Provider | mooc.fi |
| Level | Beginner |
| Workload | 35–140 hours |
| Cost | Free |
| Exercises | Available |
| Certificate | Free, if ECTS credits are registered |

Perhaps you’re disappointed by the difficulty of getting a certificate from the previous course. Well, fear not, for we have freeCodeCamp!
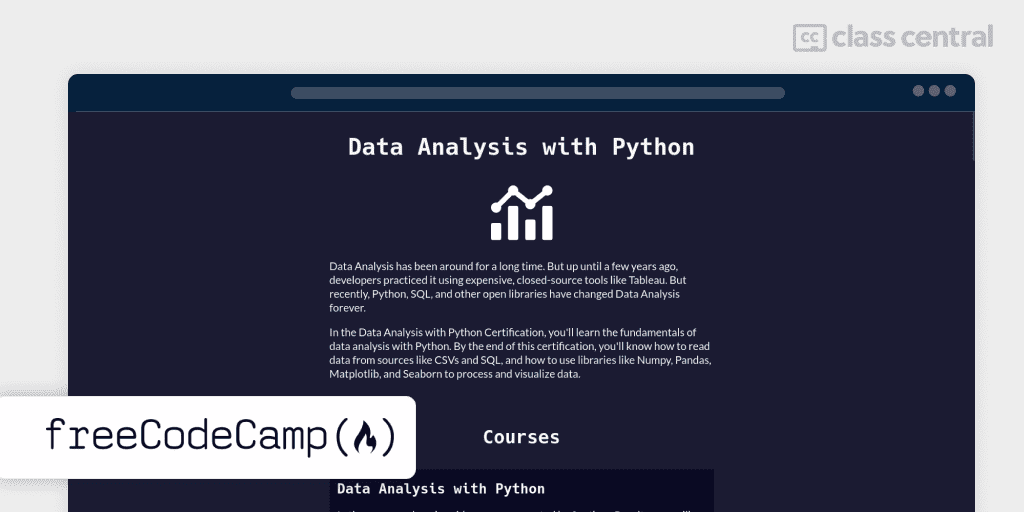
This Data Analysis with Python course is just as extensive as Helsinki’s course, minus the machine learning topics. By the end of this certification, you’ll know how to read data from sources like CSVs and SQL, and how to use libraries like Numpy, Pandas, Matplotlib, and Seaborn to process and visualize data.
You’ll learn primarily from watching the video lessons / video walkthroughs, and answering the MCQ questions to test whether you’ve been paying attention.
Of course, any certification-available course must come with projects to prove the worthy. There are a total of five projects that you must complete, of which you’ll:
- Calculate mean, variance, and standard deviation for a 3×3 matrix using NumPy.
- Explore races, education, and salaries in a 1994 census dataset with pandas.
- Plot cardiac health and lifestyle factors statistics with pandas, matplotlib, and Seaborn.
- Analyze and describe page views from 2016 to 2019 using pandas, matplotlib, and Seaborn
- Predict global sea level rise from historical data with pandas and matplotlib.
You should have some experience with the Python programming language. For example, you’ve taken the prerequisite course Scientific Computing with Python.
| Institution | freeCodeCamp |
| Level | Beginner |
| Workload | 300 hours |
| Rating | 4.8 / 5.0 (16) |
| Certificate | Free |

Are you a complete beginner willing to spend cash on a high-quality course and get a professional certificate from Google? If so, then read on!
The 6 months long Google Data Analytics Certification program (also available in French) is one of the most highly-rated (4.8 / 5.0) and popular (2.3M learners) courses for aspiring data analysts out there and for good reason. It offers a complete and comprehensive curriculum on both the data side (how to do) and the business side (what to do) of the job.
To give a brief overview of what you’ll learn from the course, you’ll:
- Understand what data analysis means and what a data analyst
- Collect raw data with SQL and spreadsheets
- Prepare data for analysis by cleaning and organizing raw data.
- Gather hidden insights from data through complex data calculations.
- Share what you found to your non-data analyst partners with data visualization tools like Tableau.
- Program in the R programming language using the Tidyverse package, one of the top 5 most widely used packages, for data analysis.
- And finally, complete a capstone project which puts together all you’ve learned so far to solve a case study of your choice.
The individual courses are actually free-to-audit. This means that you can view the learning materials, however you won’t have access to any graded quizzes, exercises or coding labs.
| Institution | |
| Provider | Coursera |
| Level | Beginner |
| Workload | 260 hours |
| Enrollments | 2.3M |
| Rating | 4.8 / 5.0 (141K) |
| Cost |


